Attribution just got harder
🚀 The new rules of conversational metrics, alongside interactive AI visuals.

Hey there 🧠
Ready for another day of staying ahead of the competition in the Growth race?
Oh and before we go ahead! If your friend sent this to you, be sure to subscribe here! So you don’t miss out on any editions.
Partnership with Thesys
Build conversational analytics agents without code

Build AI analytics agents that return charts, tables, slides, and reports instead of text. No workflows, no code.
Most analytics tools force you to set up data pipelines or build dashboards manually.
But with Thesys Agent Builder, you can build a conversational analytics agent in just 3 easy steps:
1. Upload a file or connect a database
2. Ask questions in natural language
3. Get rich visual insights in the form of charts, tables, slides, and reports instantly
Share the link with your team so anyone can explore, follow up, and generate reports on their own.
💡 How To Measure Conversational Conversions
Attribution was already complicated. Chatbot ads just made it harder.
Traditional tracking systems were built for static banners and search ads, where a click is a clean signal. In conversational interfaces, the ad placement blends into the answer. You cannot simply drop a pixel into a chat window and call it a day.
According to Eric Siu, the old attribution toolkit is not enough.
1️⃣ Stop Chasing Clicks Start Tracking Intent: In conversational environments, clicks are not the only signal of interest. Instead, focus on post-answer intent signals such as follow-up questions, topic engagement, and feedback taps. These indicators show whether the user genuinely cares about your brand. Early data suggests optimizing for these signals can drive double-digit increases in site visits compared to click-only strategies.
2️⃣ Standardize With A Clear UTM Framework: Conversational traffic must be clearly labeled. Set consistent UTM parameters such as source ChatGPT and medium paid conversational. Use campaign or content fields to encode the prompt cluster. Without this structure, reporting becomes fragmented and difficult to compare against other acquisition channels.
3️⃣ Connect Everything To Your CRM: Once users leave the chat and land on your site, server-side tagging and dedicated GA4 conversion events should capture their journey. Connecting conversational touchpoints directly to your CRM reveals true incremental revenue impact and lifetime value. Clean data pipelines are essential if finance teams are expected to trust performance numbers.
The Takeaway
Conversational ads require conversational attribution. Instead of relying on outdated click metrics, measure intent signals, enforce UTM discipline, and integrate data into your CRM. The brands that build proper measurement infrastructure now will understand revenue impact long before competitors do.
💡 How To Create Fully Interactive Images With Gemini
Static diagrams explain. Interactive diagrams teach.
Gemini now allows you to generate images that are not just visual aids, but interactive learning tools.
Here is how to use it.
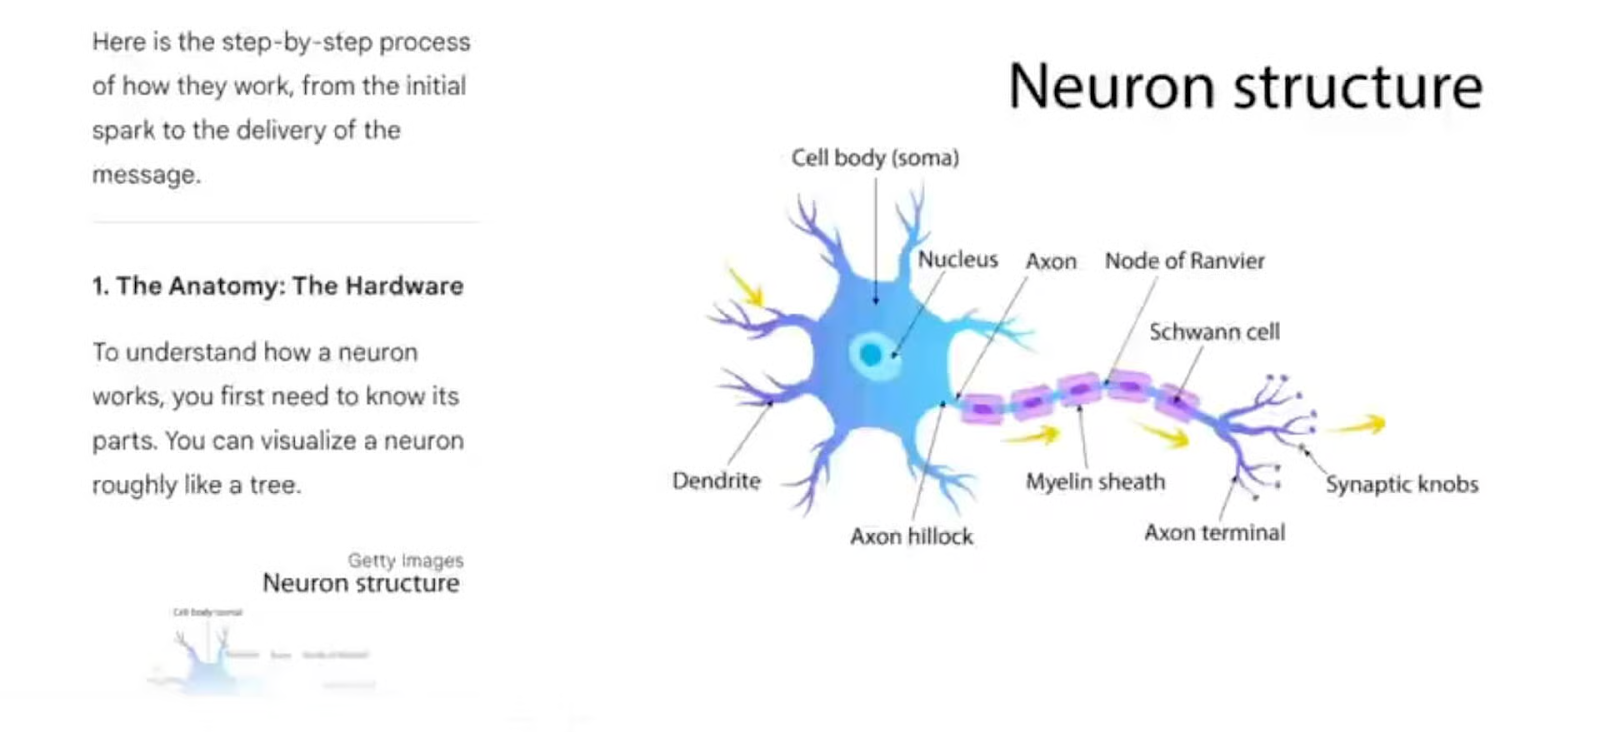
1️⃣ Start With A Clear Prompt: Sign up for Gemini and enter a detailed question or concept you want visualized. For example, asking how neurons work in the brain will prompt Gemini to generate a structured diagram rather than a block of text.
2️⃣ Generate The Interactive Diagram: Within seconds, Gemini produces a visual breakdown of the topic. Instead of a flat image, the diagram contains clickable elements designed for exploration.
3️⃣ Click To Unlock Deeper Insights: Tap or click on specific parts of the image to open interactive panels. Each section reveals definitions, explanations, and deeper context about that specific component. This turns a single image into a layered learning experience.
4️⃣ Ask Follow-Up Questions Instantly: Because the diagram is connected to the model, you can ask follow-up questions directly related to any element. This makes the image a starting point for conversation rather than the final output.
Why It Matters: Interactive visuals shift learning from passive consumption to active exploration. Instead of scanning a textbook-style diagram, users engage with each component, reinforcing understanding and retention.
The Takeaway
Gemini transforms images into interactive knowledge maps. By combining visuals with layered explanations and follow-up capabilities, it makes complex topics easier to explore and understand.
As we prepare more "Growthful" content, we'd love to hear your thoughts on today's edition! Feel free to share this with someone who would appreciate it. 🥰